


问题描述
在使用 Azure App Service(Windows 和 Linux)部署应用时,如何分析网络连接情况,尤其是查看特定端口(如 443, 3306, 6380等)的连接状态?这对于排查连接异常、验证服务是否正常监听端口、确认后端服务是否建立连接等场景非常关键。
在本地环境中,可以使用netstat命令来查看网络连接状态。但是,在App Service 云环境中,是否还可以使用netstat命令呢?
netstat 是一个用于显示网络连接、路由表、接口状态等信息的命令行工具。它可用于诊断网络问题,查看端口是否被监听、连接是否建立,以及对应的进程信息。适用于 Windows 和 Linux 系统。
问题解答
可以使用 netstat 命令在 App Service 的容器或Linux实例中查看端口连接情况, 但是在Windows环境中被禁用。
✅ 在 Linux App Service 中:
使用如下命令:
netstat -anp | grep 443
1.
-a:显示所有连接和监听端口。
-n:以数字形式显示地址和端口。
-p:显示关联的进程 ID 和名称。
grep 443:过滤出使用 443 端口的连接。
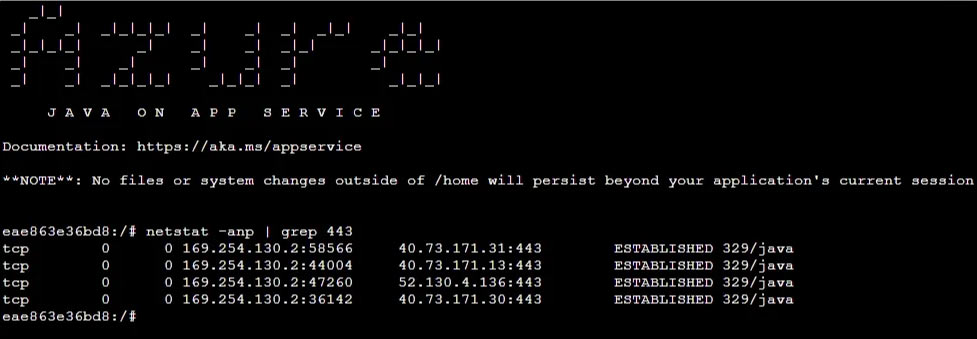
ESTABLISHED,说明这些连接已成功建立,且由进程 329/java 处理。
✅ 在 Windows App Service 中:
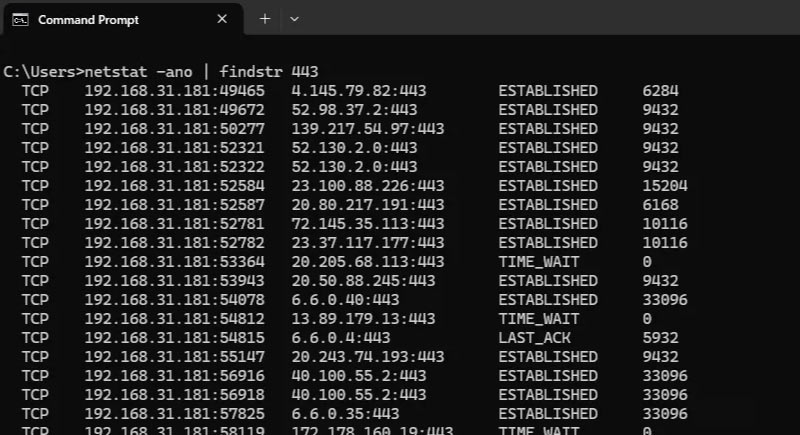
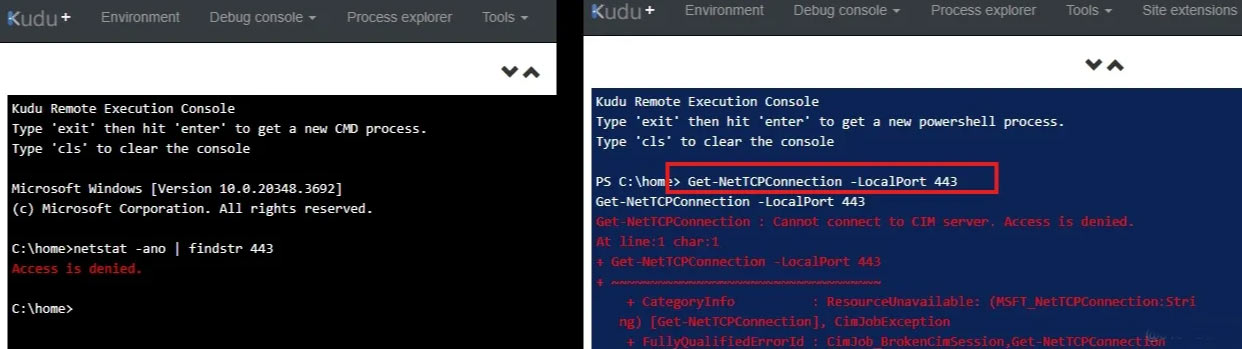
在Kudu的CMD中使用命令:netstat -ano | findstr 443
或者在Powershell中使用命令:Get-NetTCPConnection -LocalPort 443
都是Access is Denied。两个指令都被禁用了。
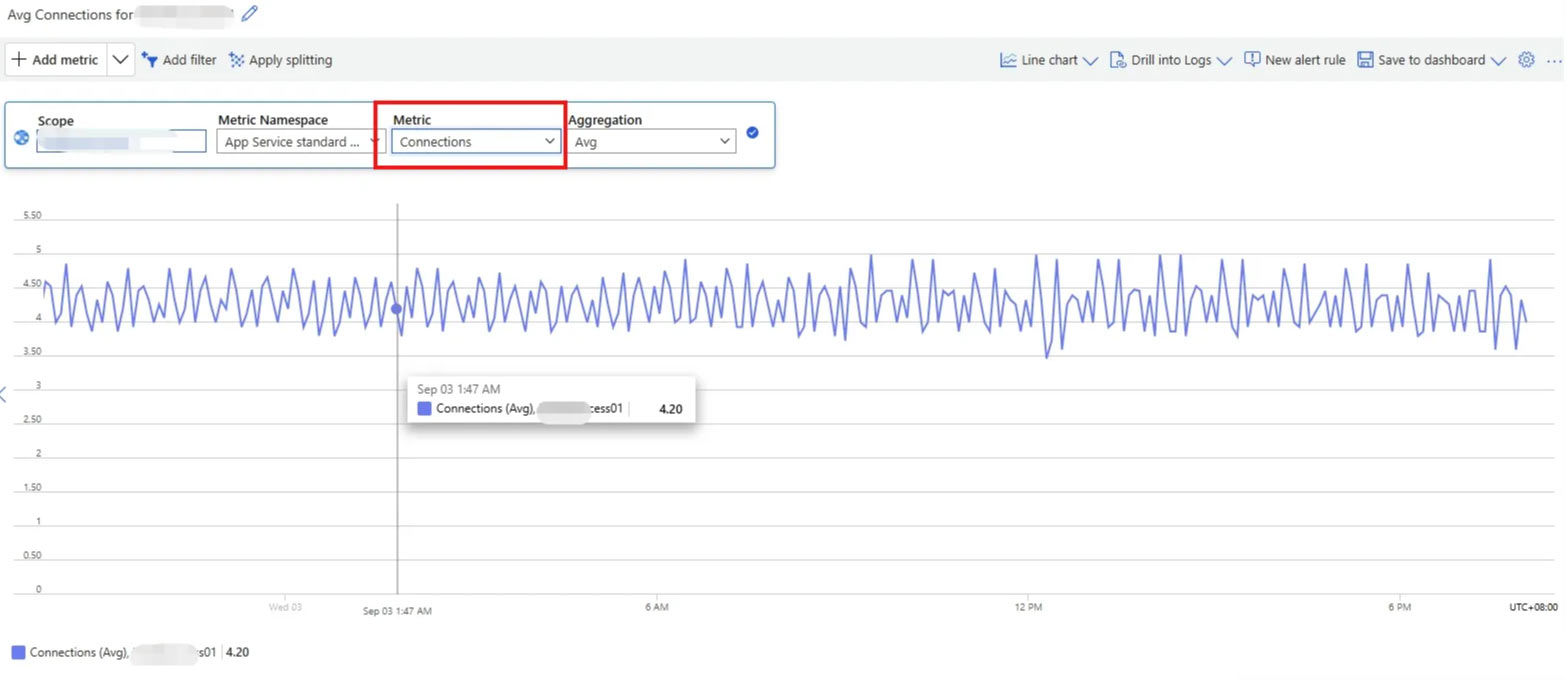
所以App Service for Windows 环境中,没有直接的方式可以查看到当前的网络连接情况。只有通过App Service 指标Connections来进行辅助判断。
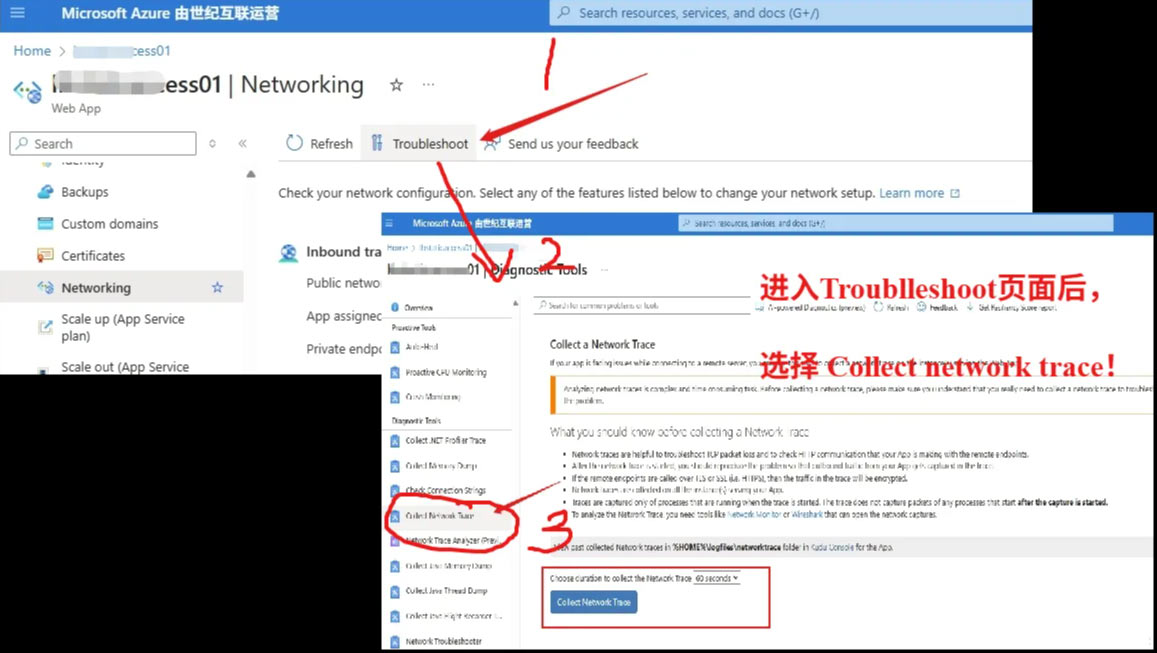
PS: App Service for Windows 可以通过门户上抓取网络包,这样可以更全面的分析网络状态。
页面导航:App Service 门户 –> Networking页面 –>页面上的“Troubleshoot” 按钮 –> Collect Network Trace
附录
Window环境中netstat命令说明
C:\>netstat -help
Displays protocol statistics and current TCP/IP network connections.
NETSTAT [-a] [-b] [-e] [-f] [-i] [-n] [-o] [-p proto] [-r] [-s] [-t] [-x] [-y] [interval]
-a Displays all connections and listening ports.
-b Displays the executable involved in creating each connection or
listening port. In some cases well-known executables host
multiple independent components, and in these cases the
sequence of components involved in creating the connection
or listening port is displayed. In this case the executable
name is in [] at the bottom, on top is the component it called,
and so forth until TCP/IP was reached. Note that this option
can be time-consuming and will fail unless you have sufficient
permissions.
-c Displays a list of processes sorted by the number of TCP or UDP
ports currently consumed.
-d Displays DSCP value assocated with each connection.
-e Displays Ethernet statistics. This may be combined with the -s
option.
-f Displays Fully Qualified Domain Names (FQDN) for foreign
addresses.
-i Displays the time spent by a TCP connection in its current state.
-n Displays addresses and port numbers in numerical form.
-o Displays the owning process ID associated with each connection.
-p proto Shows connections for the protocol specified by proto; proto
may be any of: TCP, UDP, TCPv6, or UDPv6. If used with the -s
option to display per-protocol statistics, proto may be any of:
IP, IPv6, ICMP, ICMPv6, TCP, TCPv6, UDP, or UDPv6.
-q Displays all connections, listening ports, and bound
nonlistening TCP ports. Bound nonlistening ports may or may not
be associated with an active connection.
-r Displays the routing table.
-s Displays per-protocol statistics. By default, statistics are
shown for IP, IPv6, ICMP, ICMPv6, TCP, TCPv6, UDP, and UDPv6;
the -p option may be used to specify a subset of the default.
-t Displays the current connection offload state.
-x Displays NetworkDirect connections, listeners, and shared
endpoints.
-y Displays the TCP connection template for all connections.
Cannot be combined with the other options.
interval Redisplays selected statistics, pausing interval seconds
between each display. Press CTRL+C to stop redisplaying
statistics. If omitted, netstat will print the current
configuration information once.
Linux环境中netstat命令说明
eae863e36bd8:/# netstat -h
netstat: unrecognized option: h
BusyBox v1.36.1 (2024-06-10 07:11:47 UTC) multi-call binary.
Usage: netstat [-ral] [-tuwx] [-enWp]
Display networking information
-r Routing table
-a All sockets
-l Listening sockets
Else: connected sockets
-t TCP sockets
-u UDP sockets
-w Raw sockets
-x Unix sockets
Else: all socket types
-e Other/more information
-n Don’t resolve names
-W Wide display
-p Show PID/program name for sockets